
A GRAPH BASED APPROACH FOR EFFECTIVEINFLUENCER MARKETING

AUTHORS : Salman Ansari, Muhammad Ahsan Tahir and Shahwaiz Bukhari
Techlets Pvt. Ltd.
ABSTRACT
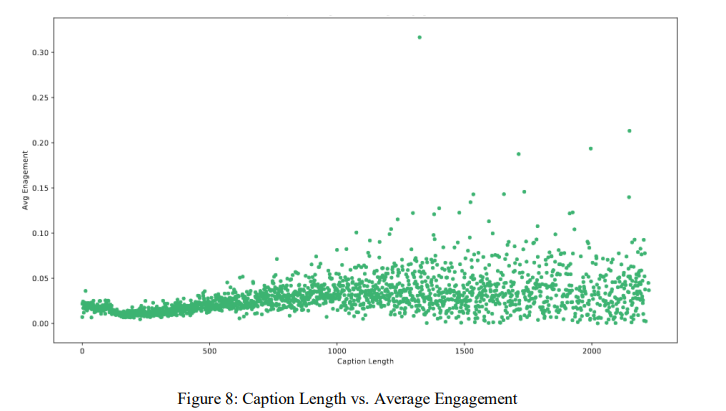
We present a novel graph-based approach to find the optimal set of influencers from a large pool of influencers. The goal is to select minimum number of influencers that can reach the desired audience. In order to find such a set, one has to compute the reach of all possible combinations of available influencers resulting in complexity of order O (2 n ). Our proposed greedy approach selects the pair of influencers that results in highest reach at every iteration reducing the complexity to O(n 2 ). Our work is complimented with analysis of 550 Instagram influencers and over 100,000 post. After the analysis, we concluded that influencers who prefer quality over quantity receives better engagement. Influencers sharing 3 posts per week and posts with caption length of over 500 characters relatively received better engagement numbers.
KEYWORDS
Graph Analytics, Influencer Marketing, Social Media Influencer, Greedy Algorithm
1. INTRODUCTION
Graph Analytics, Influencer Marketing, Social Media Influencer, GreaWith 3G/4G telecom services now common and offered at among the world’s most affordable rates in Pakistan, 67 million locals have mobile broadband internet access. According to a Gallup & Gillani poll, 48% of internet users consume online content daily[1]. One content producer category is the “Social/Digital Influencer” who are followed by ‘fans’ numbering from a few thousands (micro-influencers) to millions (celebrities). Their digital content, whether pictures, videos and live streams, are delivered on digital and social channels – Instagram, Facebook, YouTube, Beigo, TikTok – and cover a wide range of genres from lifestyle, fashion, health to entertainment and comedy.Brands can use social and digital influencers to launch and manage effective organic marketing campaigns. Pakistan’s SMEs, comprising 98%+ of all companies, actively use influencer marketing as a cost-effective strategy to engage and sell in/directly to Pakistan’s online population[2], an estimated “trade” value at PKR 5 billion*/year[3]. For sellers, influencers represent an impactful and efficient outreach channel as they affect purchase behaviors and choices, brand perceptions and even the national narratives of ~30% of Pakistan’s population[4].
2. RELATED WORK
To the best of our knowledge and research, we were unable to find any body of work directly related to our problem. We therefore propose novel approach to solve the problem of finding effective influencers by introducing the “Greedy Algorithm”.
3. KEY DEFINITIONS:
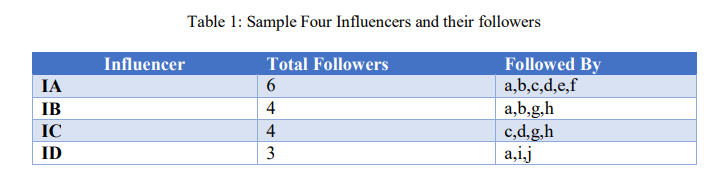
3.1. Influencers:
3.2. Overlapping Followers:
3.3. Reach:
3.4. True reach of influencers:
The number of distinct users who can be reached with selected influencers. For two influencers IA and IB,it is calculated as:
𝑇𝑟𝑢𝑒𝑅𝑒𝑎𝑐ℎ𝑜𝑓𝐼𝐴𝑎𝑛𝑑𝐼𝐵 = (𝑅𝑒𝑎𝑐ℎ𝑜𝑓𝐼𝐴 + 𝑅𝑒𝑎𝑐ℎ𝑜𝑓𝐼𝐵) − 𝑂𝑣𝑒𝑟𝑙𝑎𝑝𝑝𝑖𝑛𝑔𝐹𝑜𝑙𝑙𝑜𝑤𝑒𝑟𝑠
3.5. Engagement:
3.6.Influencer Node:
3.7. Follower Node:
4. PROBLEM STATEMENT
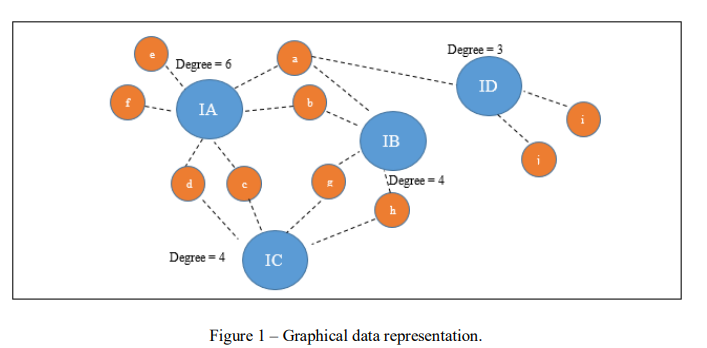
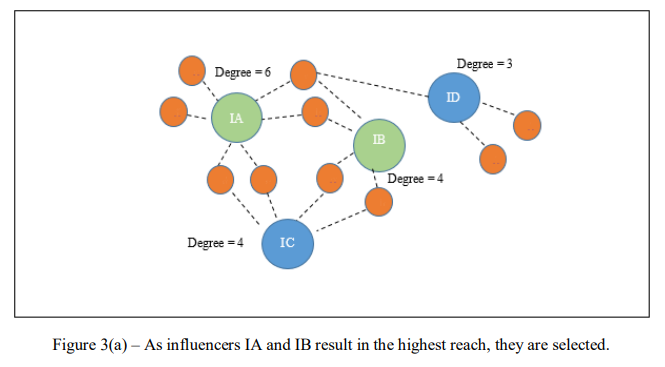
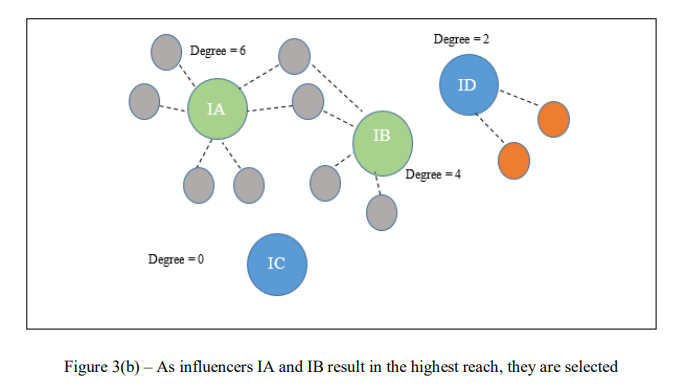
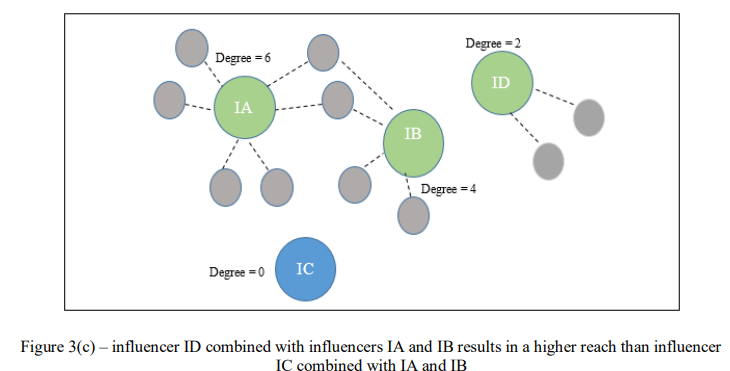
Larger nodes represent influencer-nodes while smaller nodes represent follower-nodes.
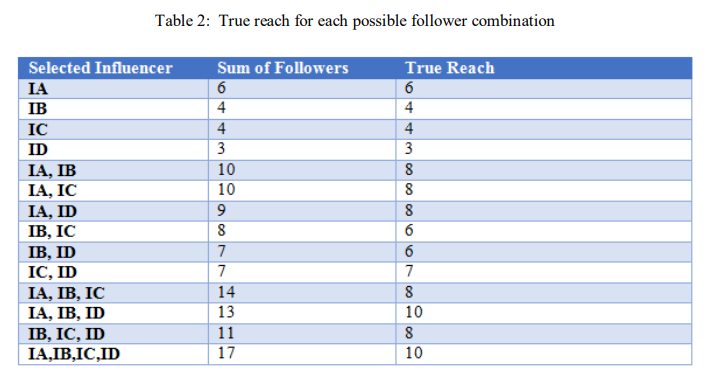
From the above scenario, influencer IC’s followers can all be reached with influencers IA and IB so the addition of influencer IC does not increase the total reach. The impact of a brand’s selection constrained by budget if they limit by having:
- Two influencers: choosing IA and ID will be more economical over the obvious choice of IA-IB or IA-IC, as the true reach of IA-ID is 8 which is the same as the true reach of IA-IB and IA-IC and more than the true reach of IB-IC that is 6, as ID has less number of followers than IB and IC and should charge less than the other two (Ref Figure 1 and Table 2), an improved reach by 33%.
- Three influencers: the combination of IA-IB-ID will be more efficient than IA-IB-IC despite the sum of total followers of IA-IB-IC (14) being more than the total followers of IA-IB-ID(13) as the true reach of IA-IB-ID is 10 while that of IA-IB-IC is 8, an improved reach of 25%.
5. OUR SOLUTION
5.1. Parameters
5.1.1 Target Reach
5.1.2 Macro Influencer Threshold
5.1.3 Micro Influencer Threshold
5.1.4 Number of Macro Influencers
5.1.5 Number of Micro Influencers
5.2. Methodology
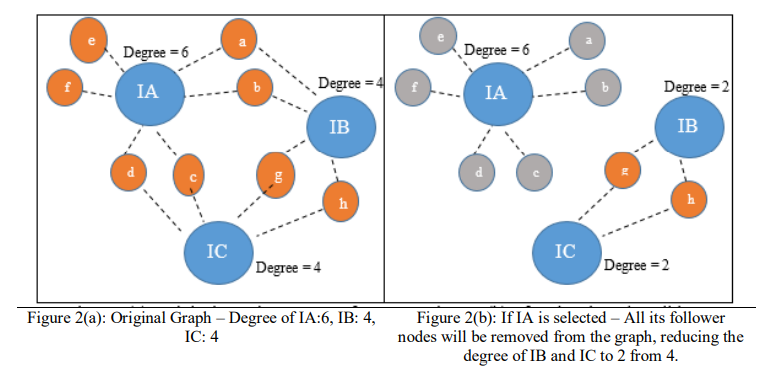
The goal is to manipulate the influencer graph so that the sum of degrees of the influencer nodes produces the true reach of the influencers. To obtain the true reach of two influencers, a two-step process was repeated until two nodes are selected:
- After selecting the first influencer node, we removed all the nodes representing followers (follower nodes) of the selected influencer from the graph.
- (2) The degree of all the influencer-nodes that were connected with the removed follower nodes will decrease ensuring that overlapping follower nodes between the selected influencers are considered only once. (Ref: Figure 2(a) and Figure 2(b))
5.3. Algorithm
For the example in Figure 2A, our follower Map will be:
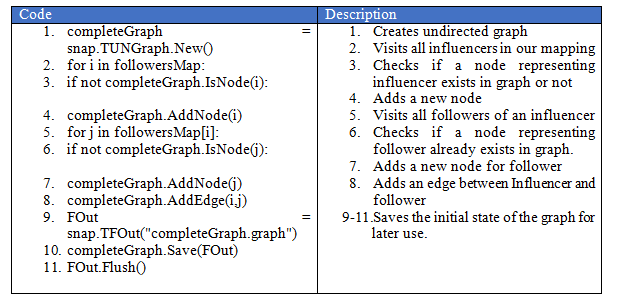
- Select an influencer node (i).
- Store the degree of influencer node (i) and remove all its follower nodes from the main graph. The degrees of all influencer nodes sharing the removed follower nodes are updated.
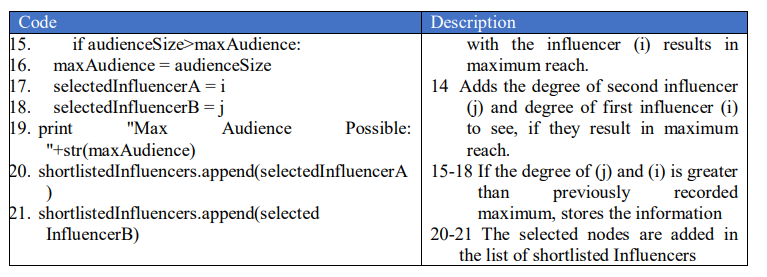
- Visit every other influencer node, add its degree to the degree of influencer node (i), and find the pair that results in the highest reach (i.e., the highest sum of degrees). Record the reach value and the selected pair.
- Restore the graph’s initial state and repeat steps 1 to 3 for each influencer node.
- Select the pair that results in the highest reach. Store the reach and remove all their follower nodes from the graph. Update the graph’s initial state to reflect this removal.
- Repeat steps 3 to 5 until the targeted reach is achieved or all influencer nodes have been selected.
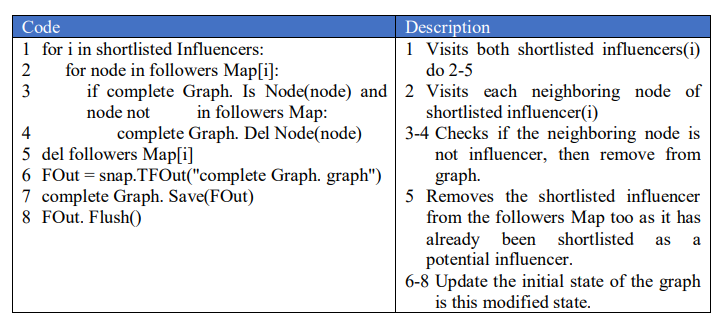
5.3.1 Finding the first influencer pair
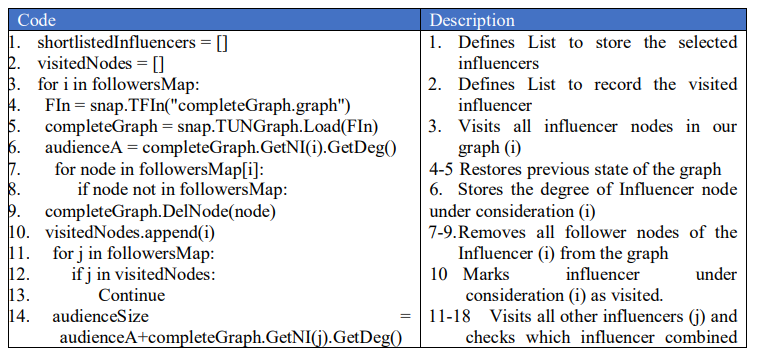
5.3.2 Update Graph States after Initial Influencer Selection
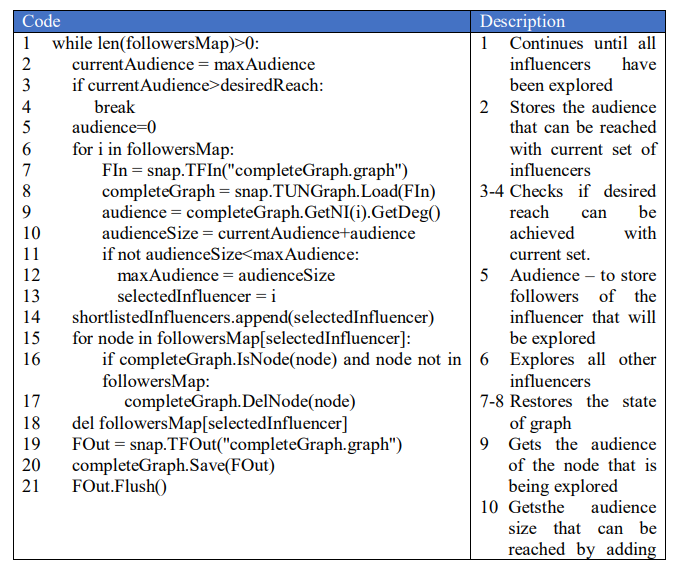
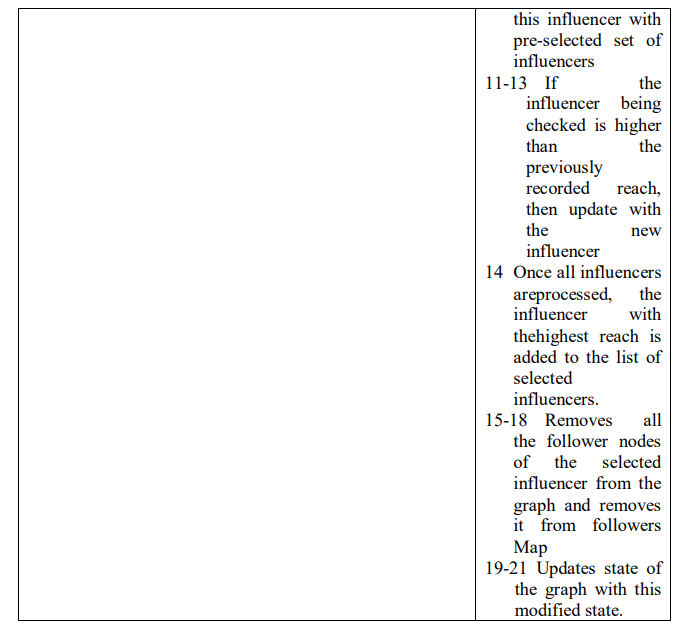
5.3.3 Iteratively selecting influencers to achieve desired reach
- The number of followers and influencer should be categorized as either a macro- or micro-influencer.
- The total number of macro- and micro-influencers who can be part of the final list of shortlisted influencers.
These parameters are important to optimize the results as per the brand’s budget. View the
complete python script at: bit.ly/2X9lalS
5.4. Implementation with High Performance Computing
5.5. Dataset
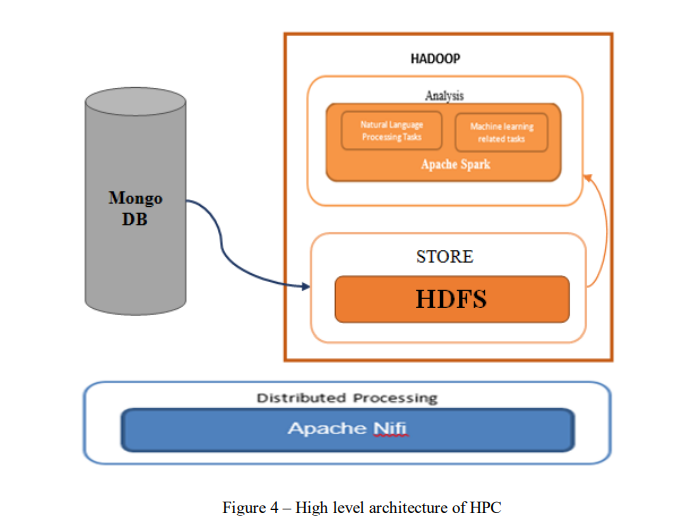
In order to make our proposed algorithm computational feasible, High Performance Computing (HPC) environment can be employed. We designed a complete pipeline using Nifi to ingest data from our database into Hadoop and calculate the reach of all influencer pairs that is needed at each iteration in parallel. Based on the results of these parallel computations, the influencer is selected that results in highest reach when combined with set of selected influencers see Figure (4).
- Public profiles including biography, number of followers, and number of people they follow.
- Publicly available profile feeds for the last six months, including post captions and the number of likes and comments received on each post.
- Followers list.
6. RESULTS
6.1. Followers Overlap
| Method | Reach of Selected Influencers | Followers Overlap | True Reach of Selected Influencers |
|---|---|---|---|
| Selecting top influencers | 1,065,762 | 341,460 | 724,302 |
| Using Proposed Greedy Approach | 1,218,568 | 183,094 | 1,035,474 |
6.2. Analysis of Influencer Profiles
6.2.1Average Engagement of a Post
The average influencers engagement was 3.28% with only 29 out of 550 influencers had average
engagement more than 10%, based on the influencers’ profile feed.
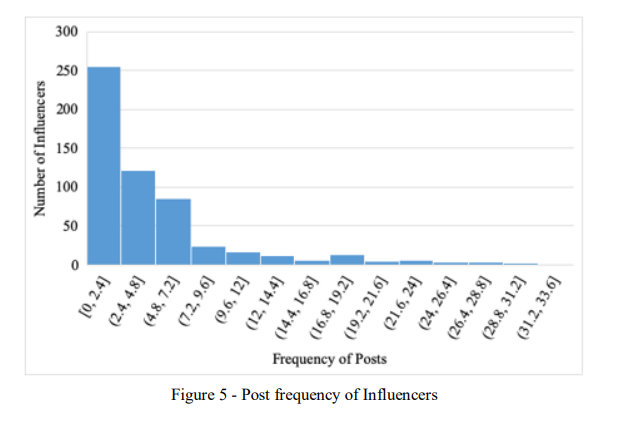
6.2.2 Post Frequency/Week
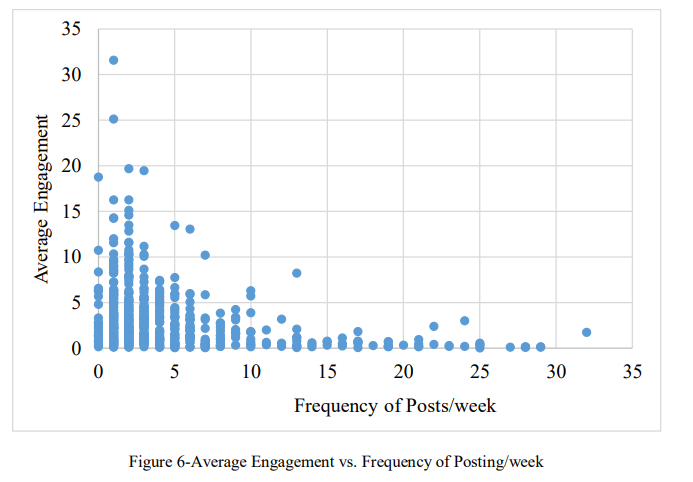
6.2.3Average Engagement vs. Post Frequency
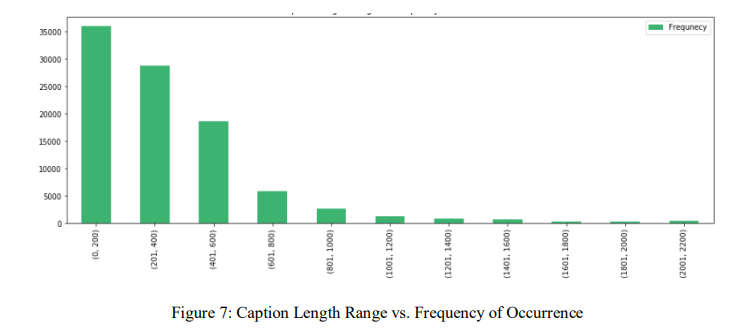
6.2.4Average Engagement vs. Caption Length
6. CONSTRAINTS AND LIMITATION
7. FUTURE WORK
8. CONCLUSION
9. ACKNOWLEDGEMENTS
REFERENCES
- Gallup & Gilani Pakistan, “48% internet users in Pakistan claim to use social networking sites to access news at least once a day”, Gallup Pakistan, https://gallup.com.pk/48-internet-users-in-pakistanclaim-to-use-social-networking-sites-to-access-news-at-least-once-a-day/, Accessed: 6-June-2019
- Pakistan Telecommunication Authority, “Telecom Indicators”, Pakistan Telecommunication Authority, https://www.pta.gov.pk/en/telecom-indicators, Accessed: 6-June-2019
- Fahad Khan Niazi, “Policy & regulatory bottlenecks for digital financial services in Pakistan”, Karandaaz, https://karandaaz.com.pk/wp-content/uploads/2019/06/Policy-Brief-New-1.pdf, Accessed: 6-June-2019
- Influencer Marketing Hub, “The State of Influencer Marketing 2019: Benchmark Report”, Influencer Marketing Hub, https://influencermarketinghub.com/influencer-marketing-2019-benchmark-report/, Accessed: 6-June-2019
- Sammis, K., Lincoln, C., Pomponi, S., Ng, J., Gassman Rodriquez, E., & Zhou, J. (2015). Influencer Marketing for Dummies. Hoboken, New Jersey: Wiley.
- Freberg, K., Graham, K., McGaughey, K., & Freberg, L. (2011). Who are the social media influencers? A study of public perceptions of personality. Public Relations Review.
- Avinash Bhamikar, A., Ramchandra Rao, P. (2012). Detecting Cliques Using Degree and Connectivity Constraints. International Journal of Data Mining & Knowledge Management Process.
- Leskovec, J., Lang, K. J., Dasgupta, A., & Mahoney, M. (2011). Community Structure in Large Networks: Natural Cluster Sizes and the Absence of Large Well-Defined Clusters. International Mathematics.
- Leskovec, J., Backstrom, L., & Kleinberg, J. (2009). Meme-tracking and the Dynamics of the News Cycle. International Conference on Knowledge Discovery and Data Mining.
- Sawhney, Kartik, Presetio, Marcella Cindy, & Pual, Suvadip (2013). Community Detection Using Graph Structure and Semantic Understanding of Text. Knowledge-Based Systems.
- Leskovec, J., & Rock, S. (2016). SNAP: A General-Purpose Network Analysis and Graph-Mining Library. ACM Transactions on Intelligent Systems and Technology (TIST).
AUTHORS

Salman Ahmad Ansari Working as a Data Scientist in Techlets Pvt Ltd., Pakistan. Area of Interests: Machine Learning, Graph Theory, Data Analysis, Social Media Marketing and Natural Language Processing.